When its comes to wages and benefits Michigan used to be among the top states. No more. The state has fallen from 8th in 1990 to 21st in 2018. Michigan has gone from $3,743 above the nation on average compensation to $4,416 below in inflation adjusted dollars.
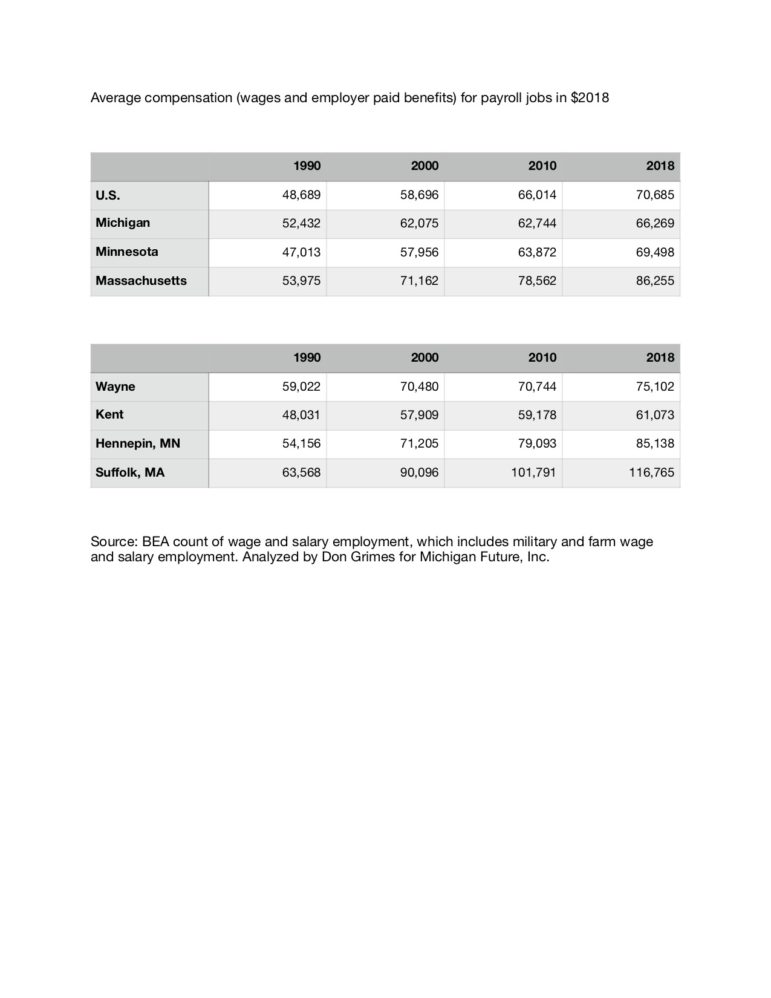
The table at the end of this post displays average compensation for the nation, Michigan, Minnesota and Massachusetts. As well as for the counties with the principal city in each of those state. The data analysis was done by Don Grimes.
The data comes from the BEA count of wage and salary employment, which includes military and farm wage and salary employment. The data also include information on average compensation per wage and salary worker. Compensation is the sum of wages and salaries and benefits paid by employers. Benefits paid by employers include government social insurance payments, like social security and unemployment insurance, and payments by employers into health and retirement funds. Neither measure includes data on proprietor’s (self-employment) employment or earnings.
Minnesota and metro Minneapolis are the comparisons we have been using for decades because they have the best economic outcomes in the Great Lakes taking both weather and we can’t be like the coasts off the table. But if you want to compare Michigan to the best in the nation, Massachusetts and metro Boston are really the better comparison.
Minnesota in 1990 had average compensation $5,419 below Michigan. In 2018 it is $3,229 above Michigan. The story is even more dramatic for Massachusetts: from $1,543 above Michigan’s in 1990 to $19,986 above in 2018.
The Michigan Future explanation of the path to prosperity in an economy being transformed by globalization and technology was first laid out in our 2004 report A New Path To Prosperity? Manufacturing and Knowledge-based Industries as Drivers of Economic Growth. We identified that the most prosperous non-energy driven states had four characteristics in common:
- A high-proportion of adults with a four-year degree or more
- An over concentration in knowledge-based services: health care; education; professional and business services; finance and insurance; information; and corporate headquarters
- A even higher concentration of both in the state’s big metro(s)
- A high proportion of adults with a four-year degree or more in those metros principal city
Minnesota and, even more so, Massachusetts share these characteristics. Michigan does not. The same is true for metro Minneapolis and, even more so, metro Boston. As you can see in the table at the end of this post a lot of Minnesota’s and Massachusetts out performance compared to the U.S. and Michigan can be explained by the robust gains in the counties that include Minneapolis and Boston.
The same basic story of wages and benefits falling behind holds true for Wayne and Kent counties. Wayne County, which includes the city of Detroit, had average compensation in 1990 $10,333 above the national average, in 2018 it was $4,417 above. Kent County, which includes the city of Grand Rapids, had average compensation in 1990 $658 below the national average, in 2018 it was $9,612 below.
All of these data are consistent with the story Eduardo Porter tells in his New York Times story Tech is splitting the U.S. work force in two. Porter details how the American economy is dividing into those who work in low-wage services and those who work in high-wage services. What distinguishes Massachusetts and Minnesota and their big metros from Michigan and its big metros is Massachusetts and Minnesota, largely because of high concentrations of college graduates in their big metros, has more of the fast-growing and high-wage knowledge-based services than does Michigan.